Lost with data visualisation tools? Comparing Data Studio & Power BI

Ever more flexible and powerful, the data visualisation landscape is also increasingly complex. If you are lost with data visualisation/BI tools, I can help you to get started.

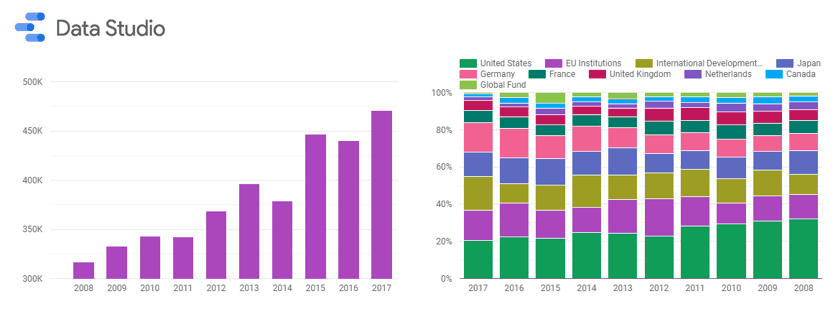
In this analytics blog I shed some light on the features and capabilities of two lead data viz players: Google Data Studio and Microsoft Power BI.

Covid-19 crisis: Free consultation for charities

The current crisis is tough on everyone. I recognise that even in the good times, charities, non-profits, and NGOs can struggle to fund, deliver, and justify their essential work.

We’ve all suffered losses in business, funding, and activity (not to mention the terrible human toll of Covid-19), so I’ve decided to offer some pro bono consultancy to any charities large or small who would like to explore the potential of data analytics.

COVID-19 (novel coronavirus) data visualisation

Following my recent posts on data visualisation and Google Data Studio, I thought I’d share another demo of the potential to visualise data beyond marketing analytics.

Once again, using the fantastic data.world open source platform, I’ve created a project for the COVID-19 crisis, which imports data from an external source. I can then link to this in Google Data Studio, along with a simple SQL query to extract the data I’m interested in.

Data visualisation with Google Data Studio

Data visualisation is all the rage. Some day in the near future, we will be done with spending endless amounts of time producing static reports in Excel, PowerPoint, and Word, instead working with eye-candy dynamic reports such as those provided by Google Data Studio, Microsoft Power BI, Tableau, and many others. These platforms allow diverse data sources to be linked in near real-time to a single report or dashboard, from where users can interact with the data.