Check out my new data analytics case study, covering my work with Over the Wall. I reviewed their analytics capabilities across the organisation and start rolling out automated insight using Power BI.


Check out my new data analytics case study, covering my work with Over the Wall. I reviewed their analytics capabilities across the organisation and start rolling out automated insight using Power BI.


Over The Wall is a UK based charity for children and young people with health challenges and disabilities to discover a world of mischief and magic.
We provide a safe place to step outside of comfort zones, establish friendships and build confidence through meaningful and exciting activities.
For much of 2023, I have been working closely with Over the Wall to help automate data reporting across the organisation. Our aim is to streamline the insights that can be achieved from highly diverse data sources, supporting better real-time decision making with greater consistency and trust.
The project has involved working collaboratively with teams and business functions across the organisation, primarily in operations and fundraising.
Work delivered includes:
Daniel has been a joy to work with.
He has taken a relatively vague brief and worked with our staff to create highly useable KPI dashboards that have enabled us to view performance in real time, become more analytical and make smarter tasking decisions.
This in turn has raised our productivity saving time/money on an ongoing basis.

Our project began with a full review of Over the Wall’s current data analytics capability.
Before launching into creating reports or analysis, it is essential to understand the context, needs, and aims of the organisation. Equally, we need to demonstrate what can be achieved with data analytics and how simple or challenging that might be. Concrete examples can greatly improve briefing for individual reports. Overall, getting insight from data is much more efficient when approached from a place of better shared understanding.
The capability review involved:
With engagement from the team, we were able to identify several issues and opportunities around data. We could also anticipate possible roadblocks or issues, both in terms of the tech and the organisational context.
In delivering the findings and recommendations, it was helpful to classify each into three broad areas that consistently emerged:
This helped to rationalise our evaluation to Over the Wall and made prioritising next steps clearer and easier.
Having interpreted the capability review and prioritised internally based on readiness and need, Over the Wall agreed to focus initial efforts on a suite of reports for camp operations. This would get us up and running with useful reports that would potentially save the team a lot of manual reporting effort, while serving as a template for rolling out automated Power BI reporting to other areas of the organisation.
With the assistance of Over the Wall’s operations team, I immersed myself deeply in the complicated data, systems, and processes around camper and volunteer recruitment. We followed a dynamic, iterative approach to refine requirements and steadily improve the reports to get them in a good state for the team.
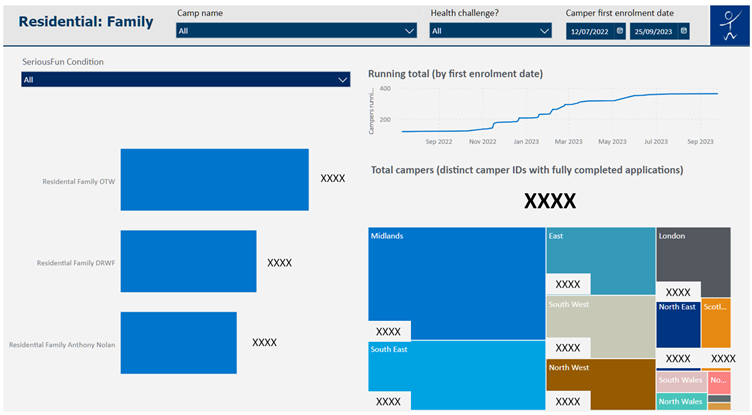
We produced three distinct reports, primarily based on data from CampSite – a bespoke camp management CRM system – but also including data from other sources, such as internal KPI targets. The data pipeline was relatively complex and involved creating custom CampSite reports with paginated API calls to extract all the useful data into Power BI. Reports ranged from a simple one-page “camper lookup” to make key personal and health details more accessible internally, to a twelve-page deep dive of camper recruitment performance across different camp types and application stages.
Once Over the Wall were happy with the reports, we published “release” versions covering 2023 camper and volunteering recruitment to the Power BI Service, ready for sharing and active use. These then served as a basis for the subsequent 2024 suite of reports, which were developed in late 2023 once the new 2024 recruitment processes were opened.

Once we reached a stable point with 2023 operations reporting, we picked up discussions with the fundraising and finance teams. Ultimately, we decided to focus on fundraising reports for our next phase, as the systems and requirements were at a more advanced stage to be able to proceed with pulling data into Power BI.
We made sure to capture a comprehensive set of requirements based on a briefing template I provided. I interrogated the brief and collaborated with the team over video calls and shared documents to ensure that I fully understood the meaning behind each request and how it mapped to data sources.
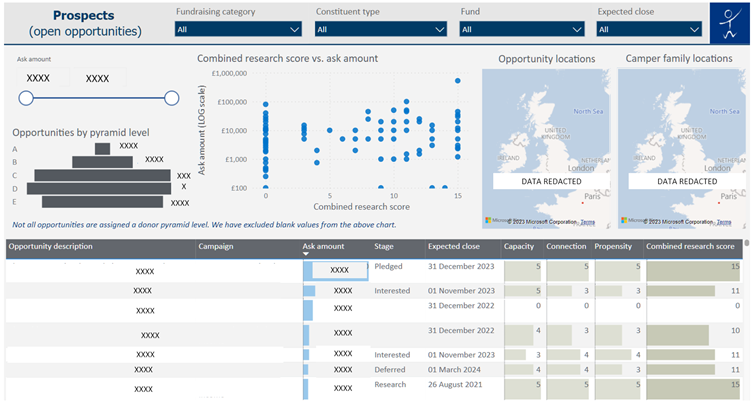
Once comfortable with most requirements, the next step for me was to produce a draft report. This achieved several requirements and showed Over the Wall the scope of what we could achieve in our data visualisations. The report combines rich fundraising data from the Donorfy CRM with camper data from CampSite, along with targets and category mappings held in separate Excel spreadsheets within Microsoft 365. Key features of the report include monthly performance vs. targets using an intuitive time period selector, yearly summary, performance by fund and campaign, and an opportunities explorer to help surface and categorise the most promising fundraising prospects.
Through the report creation process, Over the Wall identified several areas where the underlying Donorfy data could be cleaned, extended, or made more consistent. This will be undertaken by Over the Wall in early 2024, after which the report will be iteratively developed to make full use of the new, cleaner source data and satisfy the full insight brief.

It’s crucial for clients to be confident enough to understand and interrogate reports to get the insight they need. Some ability to maintain and update reports is also useful, although this can be challenging for non-experts when it comes to a complicated platform like Power BI and its bespoke data pipelines.
With Over the Wall, we demonstrated several features at appropriate stages in the development process. These features included the two different Power BI environments, report navigation, filters, slicers, cross-highlighting, and drilling into underlying data. We produced a reporting walkthrough guide and ran a live training session with the operations team.
For fundraising, we also provided detailed technical handover notes on the report setup and data sources. This will help other users take over report development, updates, and maintenance in 2024.
We have produced a varied, useful set of automated reports for key Over the Wall business functions. In doing so, we assessed the organisation’s analytics capability and identified much of what they need to attain better insight in future. Through our Power BI report development, we also helped to highlight issues with existing data collection and underlying systems, which Over the Wall are now working to improve.
Teams are much more familiar with Power BI – and report automation in general – than they were previously: I strove to explain and document my work throughout, rather than simply providing “black box” report outputs. A crucial success factor for me is that individuals and teams are empowered to get more out of data themselves: I feel that Over the Wall, having already had a strong skill set across the team, are well along this path.
I believe we have laid some solid foundations for Over the Wall to develop and grow their data analytics insights long after my consultancy has ended. I sincerely hope these capabilities can help the organisation go from strength to strength in providing their wonderful service to children and young people with health challenges and disabilities.
You can find me on LinkedIn, or email me at [email protected]
(Please note I'm no longer freelancing, but keen to connect with others in the world of data for social impact!)

Ever more flexible and powerful, the data visualisation landscape is also increasingly complex. If you are lost with data visualisation/BI tools, I can help you to get started.
In this analytics blog I shed some light on the features and capabilities of two lead data viz players: Google Data Studio and Microsoft Power BI.