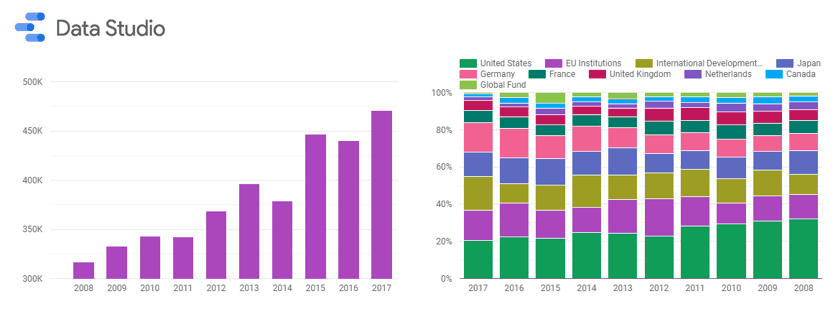
Data visualisation is all the rage. Some day in the near future, we will be done with spending endless amounts of time producing static reports in Excel, PowerPoint, and Word, instead working with eye-candy dynamic reports such as those provided by Google Data Studio, Microsoft Power BI, Tableau, and many others. These platforms allow diverse data sources to be linked in near real-time to a single report or dashboard, from where users can interact with the data.

