

With much fanfare, Google have launched Google Analytics 4 (GA4) and rebranded Looker Studio. They’ve also seen fit to destroy the most simple, established way to create custom reporting dashboards with these tools.
Cue facepalms for analysts and marketers alike. Let’s try to get our data working positively again.
What’s the problem?
In November 2022, Google started to enforce strict quotas for the GA4 reporting API. Bizarrely, this even affects their own recommended platforms like Looker Studio for business intelligence/data visualisation. As a result, the native GA4 connector for Looker Studio is next to useless: free quotas are quickly burned just by viewing a few simple charts or pages.
Analytics 360, even for those who can afford it, doesn’t fare much better: quotas are only 10x those of free GA4 properties.
These quotas just aren’t enough for any serious dashboard reporting.
So how can we report GA4 data in Looker Studio?
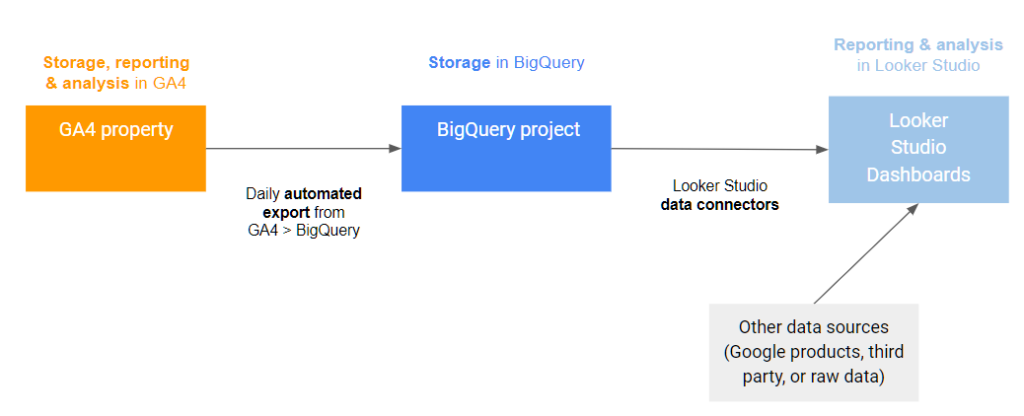
The recommended solution at the time of writing is to use BigQuery as an intermediary data store. BigQuery is a data warehouse product that is part of Google Cloud.
GA4 has a free integration with BigQuery, allowing you to automatically export data each day. The BigQuery data can then be used as a data source for Looker Studio reports.
This gets around the API quota issue, and also offers additional benefits:
- Longer term custom reporting (beyond the 14 month limit found in GA4 itself)
- No data sampling
- No data thresholding.
While the GA4 > BigQuery integration is a core feature of free GA4 properties, BigQuery can cost money for storage and querying. There’s a free monthly allowance that should be enough for many small organisations, but larger organisations will need to anticipate usage with more care.
A quick web search brings up many articles that will show you how to set up a basic GA4 > BigQuery integration or connect to BigQuery from Looker Studio.
In the rest of this article, I want to focus on how to actually report and visualise the data once you’re set up. I’ll also cover how to monitor your BigQuery data, and some of the main pitfalls that can interrupt your data pipeline.
Tips for reporting in Looker Studio
Creating Looker Studio reports using BigQuery is a different beast to using the native GA connectors.
BigQuery just stores a big database of raw GA4 event data, which means that we have to do additional data processing, filtering, and cleaning.
We don’t have many of the metrics and abstractions available directly in GA4, particularly session data, demographics & interests, and the ability to segment. Custom SQL queries may be needed for BigQuery connectors, especially to support things like session metrics, segmentation, or filtering by custom dimensions in reports.
This all hurts our ability to report and analyse data, especially for those who are not analytics experts or don’t have technical knowledge. But it’s a pain even for seasoned analysts due to the extra steps and complexity in creating reports.
On a positive note, GA4 data from BigQuery is not subject to sampling or thresholding: this makes our end reports much more accurate and reliable! Comparing BigQuery data to GA4 reports can be enlightening, especially for dimensions with many rows featuring small amounts of data (where GA4’s thresholding can run riot).
Looker Studio reports built with BigQuery data also tend to be quicker and more robust.
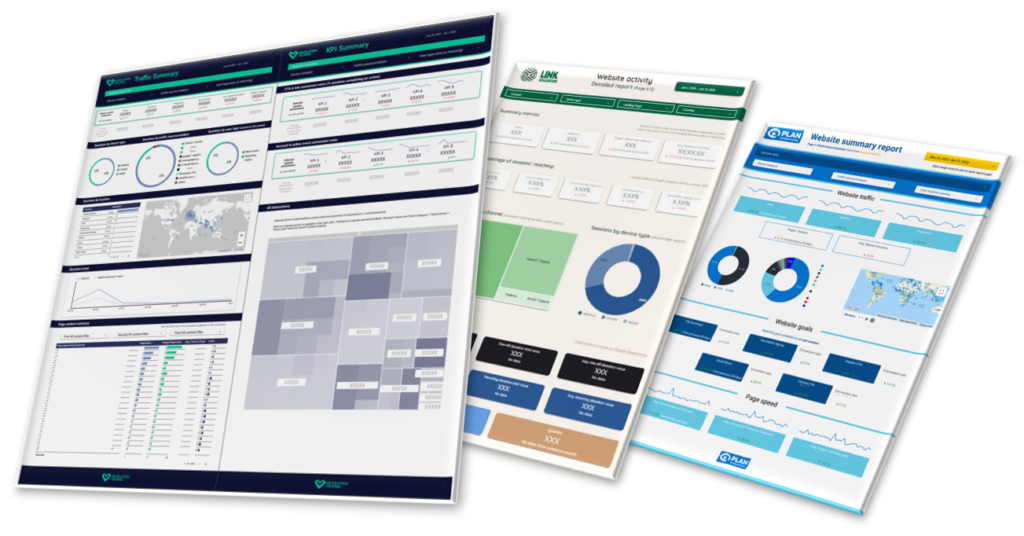
Having recently created several Looker Studio dashboards for my non-profit analytics clients, here are some pointers for reporting BigQuery data from GA4:
- Focus on user and event level metrics. You can get session data, but sessions are an abstraction that often require custom SQL queries to build out.
- For advanced users/gluttons for punishment, here’s a great guide to calculating common session metrics using SQL queries.
- Become very familiar with Looker Studio filters. Even for a simple page views report, we would need to use a component filter that pulls out “Event Name” equal to “page_view”.
- There are far fewer pre-built metrics than you will be used to from the GA connectors. You will typically need to define metrics using techniques like counts or distinct counts of fields, creating calculated fields, or employing data blending (advanced).
- Make the most of the standard dimensions attached to every GA4 event data point.
- Custom dimensions can also be used quite freely, but may not be available for all events, e.g. “session_start”.
- When it comes to filtering by event level dimensions and reporting multiple parameters, you’re probably going to need some custom SQL. Specifically, you can use the UNNEST function to pull out parameters from records into distinct columns of their own. Here’s an excellent guide to using UNNEST with BigQuery data.
- If using custom SQL queries, you need to be mindful of performance (and ultimately, cost!) Looker Studio spawns several queries every time you change your report config or users change filter values. This quickly mounts up!
- Guidelines include parameterising your query to only select data for the current date range and selecting only the columns you need. It’s helpful to preview your query in BigQuery first, as you will see an estimate of how much data the query processes and can also explore the data structure.
If you’re struggling with creating Looker Studio reports based on BigQuery data, it’s best to get a data analyst with some technical knowledge on board. The BigQuery/database paradigm is tricky and not as intuitive as reporting with the native GA4 or Universal Analytics connectors.
Sometimes we might just have to cut our losses and focus on the data that we can get with ease, rather than breaking our backs trying to replicate historical reports.
BigQuery pitfalls
It’s wise to keep a close eye on Google Cloud/BigQuery, even once you’re set up successfully and have a nice report built. There are several areas where the data pipeline might fail (learned through bitter experience!)
Here are some core BigQuery setup and troubleshooting tips, for those of us not fortunate enough to be Google Cloud engineers:
- Make sure you’re connecting to the correct Google Cloud project ID from GA4 and have admin/edit credentials for both platforms.
- Set up your Google Cloud billing account correctly, using a valid payment method.
- Be sure to update the payment method if it expires or changes.
- Monitor emails sent to the billing account in case of any alerts or warnings.
- You must actively upgrade to a paid Google Cloud billing account at the end of any free trial.
- Periodically check your GA4 data tables in BigQuery.
- The most recent tables should have been created 1-3 days ago. Any longer than that and you may have an issue. The best way to check is to go right into the BigQuery workspace and check your list of tables and dates.
- There’s also a BigQuery usage dashboard built into Google Cloud, or you can create custom dashbords to monitor things like number of tables and bytes stored over time.
- Make sure your default table expiration and individual table expirations are set to “never” in BigQuery.
- This means that tables won’t be deleted after a certain period of time: that wouldn’t be ideal for historical analysis!
- You might find it helpful to pin key Google Cloud sections to your navigation (I suggest BigQuery, Monitoring, Billing, IAM & Admin), or use the search bar. The interface and navigation is complicated and overwhelming even for experts.
I hope this article has given you a solid overview and some practical tips for visualising Google Analytics 4 data in Looker Studio, via BigQuery.